Tuesday, December 27, 2011

Euro Bearish ?

*source - Societe General Research


Hedge funds have been building short positions on Euro. position of this scale has not been observed in while. it seems the fund managers are unanimous about the direction of Euro against dollar. but we can see that the last time when market was such bearish about Euro , what followed next was a complete reversal. i think one needs to be extremely cautious going short at this stage .

FT Alphaville awards


Wednesday, December 21, 2011

Shifting Trends in World Trade


An enterprising Englishman in 1850s famously said that if the "could add an inch of material to every China man's shirt- tail, the mills of Lancashire could be kept busy for a generation " - Economist 


The next decade will see a role reversal in world trade. The devloping countries would be consuming and they will form the major chunk of reports .


MF Global Bankruptcy - The real reason

MF’s main business was executing and clearing trades for clients. The company was a dinosaur. It still took most of its orders over the phone, long after the industry had shifted to electronic trading. Not surprisingly, MF reported net losses for each of the past four fiscal years. Its $186.6 million loss last quarter was its biggest.
Most of the quarter’s red ink came from writing down something called deferred-tax assets. Basically this item represented the money MF had thought it would save on taxes in the future, assuming it would be profitable. Net deferred taxes stood at $108.3 million as of March 31, according to MF’s 2011 annual report, which was the last time the company provided a detailed tax footnote.
MF wrote down that figure entirely last quarter. In essence, MF’s executives were admitting they couldn’t figure out how to make money. 

Interesting take on the real reason which led to the fall of MF Global. Read the complete report here 

Tuesday, December 20, 2011

Joseph Stiglitz: On Depression

One of the best insights in to depression. Please read the complete article here

Joseph Stiglitz: “A Banking System is Supposed to Serve Society, Not the Other Way Around


Many have argued that the Depression was caused primarily by excessive tightening of the money supply on the part of the Federal Reserve Board. Ben Bernanke, a scholar of the Depression, has stated publicly that this was the lesson he took away, and the reason he opened the monetary spigots. He opened them very wide. Beginning in 2008, the balance sheet of the Fed doubled and then rose to three times its earlier level. Today it is $2.8 trillion. While the Fed, by doing this, may have succeeded in saving the banks, it didn’t succeed in saving the economy.

 Reality has not only discredited the Fed but also raised questions about one of the conventional interpretations of the origins of the Depression. The argument has been made that the Fed caused the Depression by tightening money, and if only the Fed back then had increased the money supply—in other words, had done what the Fed has done today—a full-blown Depression would likely have been averted. In economics, it’s difficult to test hypotheses with controlled experiments of the kind the hard sciences can conduct. But the inability of the monetary expansion to counteract this current recession should forever lay to rest the idea that monetary policy was the prime culprit in the 1930s. The problem today, as it was then, is something else. The problem today is the so-called real economy. It’s a problem rooted in the kinds of jobs we have, the kind we need, and the kind we’re losing, and rooted as well in the kind of workers we want and the kind we don’t know what to do with. The real economy has been in a state of wrenching transition for decades, and its dislocations have never been squarely faced. A crisis of the real economy lies behind the Long Slump, just as it lay behind the Great Depression.

 For the past several years, Bruce Greenwald and I have been engaged in research on an alternative theory of the Depression—and an alternative analysis of what is ailing the economy today. This explanation sees the financial crisis of the 1930s as a consequence not so much of a financial implosion but of the economy’s underlying weakness. The breakdown of the banking system didn’t culminate until 1933, long after the Depression began and long after unemployment had started to soar. By 1931 unemployment was already around 16 percent, and it reached 23 percent in 1932. Shantytown “Hoovervilles” were springing up everywhere. The underlying cause was a structural change in the real economy: the widespread decline in agricultural prices and incomes, caused by what is ordinarily a “good thing”—greater productivity.

Monday, December 19, 2011

USD BreakOut

USD on the higher side can forebode more downside for commodities

Tuesday, December 13, 2011

The Curious Case Of Correlations

Did Facebook led to Greece default ? ... Interesting take on correlations.

Gold Correction

Gold, on charts is making a symmetrical triangle pattern. The pattern suggest a big price movement in near future or a break out on either side. Gold has an equal probability of moving on the higher side as well as the lower prices Case for higher prices - The bull market in gold is still intact. Gold is still trading on the higher side of all its long term movie averages. All the dips in Gold were bought into , which does reminds us bull phase of gold markets. Crisis in Europe deepens and flight to quality ensures higher prices for gold. QE 3 arrives pushing USD to lower values, fueling gold rally. Case for lower Prices. Europe Crisis resolved would push gold prices down. Low growth and low inflation makes gold unattractive as inflation hedge

Monday, December 12, 2011

The Great Euro Escape Plan

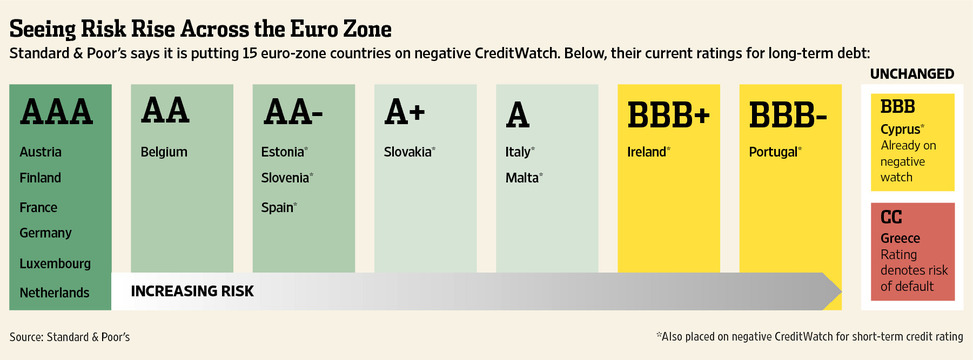
Markets were very volatile last week, featuring European Central bankers, the EU summit, potential credit rating downgrades, falling demand for eurozone government bonds and downward revisions of economic growth, all related to the on‐going sovereign debt crisis. After the downgrades of Belgium, Hungary and Portugal two weeks ago Standard and Poor did not beat around the bush. They placed 15 out of 17 of the eurozone bloc on watch for possible downgrade. On Friday, Moody's downgraded the three biggest French banks SocGen, Credit Agricole, and BNP Paribas by one notch. On global growth the IMF warned that it could lower estimates in January, just as the OECD did two weeks ago, lowering 2012 to 3.4% from earlier estimates of 4.6%, then 3.8%. The ECB, in cutting its interest rate to 1%, also cut its eurozone GDP growth for 2012 to 0.3% from 1.3% in September. The attempts to solve the eurozone problems and save the common currency continue to struggle. Last week's summit ended up with 23 out of the 27 EU members agreeing to treaty changes, with three more ‐ Hungary, Sweden and the Czech Republic ‐ expected to join once their parliaments approve. Britain was left as the odd one out, but David Cameron had no choice after he was unable to persuade his EU colleagues to drop the Financial Transaction Tax that they believe is essential. Presumably we will now see financial firms moving to the UK, or Switzerland now that the tax is destined to be implemented just about everywhere else in Europe. The European Stability Mechanism ceiling will be 500 billion euros, but because of German opposition, the facility will not receive banking licence, and therefore will not be able to borrow from the ECB to lend to troubled EU states. However, the EU did manage to find an additional 200 billion euros from individual central banks to lend to the IMF for onward lending. Serious efforts are being made but the progress is slow and the markets do not seem to be convinced yet

Wednesday, December 7, 2011

Monday, October 31, 2011

US Dollar

US has fallen back to its previous range. USD was stuck in the range of 73.50 to 76.50 for 6 longs months. and then it broke the range to enter the another higher range of 77.50 to 81. thought i feel that USD should remain in the upper range of 77.5 - 81 as it US economy is slowly showing some signs of prospect and right now its much better placed than europe. USD might only remain in the lower range or breach the lower range if QE 3 is around. right now there is a lesser probability or possibility of QE3 in next 3 months

Wednesday, October 26, 2011

Brent WTI Spreads

in my earlir post i spoke about that triangle pattern being formed and my hunch for spreads moving upwards. As one can see that BW has finally broken the trend and its poised upward. Though it fell before rising upwards but it was only due to the expiring Brent that month

Monday, October 10, 2011

Brent WTI spreads

The Brent WTI spreads which widened to the historic highs of $ 26 per barrel seems to making way back. For past one month its making a higher low pattern which suggests that the short term bottom has been made and its on its recovery path. the triangle pattern which is being formed can lead to a break out on one side, the probability is more on the higher side for this spread.so in next few months we can see considerable upside in this spread

Sunday, September 25, 2011

Correction in Gold

Finally gold showed some sign of correction to its long rally.On charts it has made short term high for sure. the double top formation has actually been formed and the actual price target on the lower side could be around 1500. but i believe it will take a some time to reach those levels and there is short term bounce back that might happen. gold has reached to its Fib levels, that is 61.8 % correction levels of its last move.Moreover 100 dma at 1630 levels would also provide considerable support. if that breaches the next support would be 1575 and then 1500.

Friday, September 16, 2011

Philly Fed and Recession

Whenever philly fed index has breached into negative territory, it is followed by a recession. Last philly fed data is indicating another recession around the corner

Friday, September 9, 2011

Dollar Breakout

DOllar has moved passed its resistant and broken out of it range. there are a previous breakout also last time in july but it tuned out ot be a fake one and market went back into its previous range. Dollar hold key to most of the markets right now. Since most of the markets are clueless and stuck in a range, a break out in dollar would be important for the direction of the market

Tuesday, September 6, 2011

Volatility and Vix

The vix looks like that it is in range. The market is entierly news driven with bouts of bad news increasing the volatility and thn positive news pacifies the market. this shows the overall trend of all the markets which i believe, will be in range for next couple of months.

World GDP and Trade

World trade is shrinking and it has been an indicator of growth of world GDP. the amount of cargo passing through the Suez Canal in Egypt. Approximately 8% of the world's international trade is estimated to flow through the canal, so it acts as a good early indicator of the prevailing economic conditions.

Tuesday, August 30, 2011

Commodities at historic highs


Commodity markets have reach to their historic highs. but will commodity prices would sustain in such low growth environment. Societe general depicts tht commodity prices might show some correction with such level would be difficult to maintain


Monday, August 29, 2011

Key Levels for all markets


Important levels for equity and commodity markets


source Macroman.wordpress.com

Wednesday, August 24, 2011

Correction in Gold


FInally we saw some correction in Gold, but is it the reversal we were waiting for. i dont think so. Gold is in bull phase and to play a bull market is to buy the dips. i think 1725 to 1700 will give a very good entry.

Nifty Rollover

Nifty rollover stands at 23.93% on E-3 day basis, marginally below its 3-month average of 25.86%. Long roll cost (excluding dividend) decreased to 5-6 points from 11-12 points as observed in the previous week. Despite the fact that long roll cost on E-3 day basis stands lowest in last 2 series, rollover continues to remain in line with past average indicating lower probability of any significant expansion in the roll cost.

Market-wide rollover (excluding index) stands at 31.21% as against 34.48% observed in the previous expiry. Higher rollover was observed in Power (45.24% Vs 41.04%) and Energy (34.47% Vs 32.99%). Lower rollover was seen in sectors such as FMCG (32.55% Vs 38.28%), Technology (25.87% Vs 30.87%) and Cement (30.65% Vs 35.15%).

Observing the open interest concentration pattern in the September series, maximum accumulation among call options is concentrated at 5400 strike (2.31 million shares) followed by 5000 strike (2.27 million shares). Among put options, maximum open interest is concentrated at 5000 strike (3.84 million shares) followed by 4800 strike (3.55 million shares). With global markets showing signs of consolidation, we expect a downward shift in the accumulation pattern to 4800 put option and 5000 call option.

It not all that bad

Admist double dip frenzy and scaremongering, there are few data which is not all that bad.


New home sales figure , though disappointing, is still showing growth.

Baltic Dry index which is indicator of econmic activity has also shown improvement


So summing it up , there are chances of recession but it might be another slow gorwth phases and not the one which we saw in 2008

Monday, August 22, 2011

Philly Fed and Payroll

and interesting chart which shows the correlation of Philly fed Index and Non Farm Payroll. If the correlation proves to be true than we can imagine the horrible NFP number waiting for us

Oil remains bearish

Crude seems to be a in bearish set up, as both fundamental and technical reason point southward direction.With Libyan issue closing for a conclusion and techincially the much dreaded death cross formation on the chart. the upside tends to be limited. i still dont see Oil prices tumbling down and i have a strong view that oil will make a range and will trade a big range.

Tuesday, August 16, 2011

Debt as Percent of GDP


The lost decade for US


American economy is exhibiting similar trends which were present in Japanese Economy during the Japanese Lost Decade. Barry Riholtz has an interesting observation as he compares MSCI US and MSCI japanese index and comes out with startling results.


though its too early to make such prediction. there are also difference between US and jaoanes economy as Fed is pumping money into the system which Japanese never did. Moreover the demographic were very different as Japan was ageing much faster than US

Friday, July 15, 2011

Equity and Oil Correlation


As oil remains at higher levels, the correlation of crude oil and equity markets are slowly receding. IN last couple of year, the correlation has moved from negative to positive and now the correlation seems to reducing. Circa 2008, when oil made a high of $ 147 . the corrleation was negative as the highger crude prices were squeezing profit margins of companies and stoking inflation. but in 2009 when world was struggling with recession, oil and equity markets had strong positive correlations as better economic scenario meant more demand for crude.

Monday, July 11, 2011

WTI-Brent Spread Widens.


WTI brent spreads has again widened to record levels. The Brent-WTI price differential held above $22 per barrel on Friday after a dismal non-farm payrolls number and neared its record high of $23.34 set on June 15.

While both benchmarks have historically traded within dollars of each other, the price differential is “here to stay”. Data shows that stocks at Cushing remain 37% above their 5-year average at 37 million barrels. this oil glut has created a pressure on WTI which looks much weaker compared to Brent.
Tension in Libya does not seem to end anytime soon.with ramadan approaching Nato will have to stop the attack on Gaddafi forces, which elonagates the civil war for one more month. Nato also attacked Libya's Oil installation to starve gaddafis without oil. All these factors are creating upward pressure on Brent.

At the same time, rising hostilities between oil producer’s cartel OPEC and IEA, the west’s oil watchdog, have made the market nervous

these factors will create will not let WTI Brent spreads to recover anytime soon

Tuesday, July 5, 2011

GDP and Recession

An interesting data, Whenever real GDP growth of US falls less 2 %. It is followed by a recession.
Amercian GDP growth is very much near that pivotal 2 % mark. if GDP shrinks any further, a deep slowdown may be in offing

Monday, July 4, 2011

USD vs Stocks


Historically US Dollar and equity markets share a negative correlation. USD after making a low, is showing some strength and might bounce back. this is not a good sign for equity market whcih is already on its weaker side. any appreciation is USD can bring a decent correction in equity markets

Tuesday, June 28, 2011

Correction in Gold and Silver

Gold broke its long term trendline, which is bearish for Gold. Gold can spike up to test the trend line again but upside is limited unless it crosses that trend line. A lot would also depend upon the greece bail out. any systemic risk can push gold higher


Silver is also bearish. after making a Traingle pattern on the charts .it broke out of that traingle on the lower side. its a text book techincials which might push silver to lower levels

Monday, June 20, 2011

Breakout in VIX


VIX index has broken its current resistance and it can scale higher in current uncertainty about markets and economy.VIX index generally sense the turbulent markets and it can also be called the fear inde of markets.Last time when VIX broke these levels it knocked off good 7-8 % of the market. considering market already around its lows and spike in VIX index can be detrimental to the markets

Friday, June 17, 2011

Silver


A pennant or a triangular formulation may drive silver prices to lower levels. conisdering gorwth concerns and cooling Chinese economy, silver has more reason to test lower prices

Thursday, June 16, 2011

Equity markets looming over bear phase


SnP 500 is on the thin red line of 200dma. Technically a close below 200 DMA will ensure prolonged correction and a bear market in near future. So next few days or weeks will determine where are we headed for the future. last few of my post suggest that there may be deep correction in the offing.now the question is what will trigger that, will it be greece or euro default or insane commodity prices, or maybe anemic growth.

Sunday, June 12, 2011

Bond Market Suggest another sell-off


Another indicator which suggests a sell off in near future. For last few weeks i ve been looking into a lot of indicators (few of the thm i ve already posted) which are suggesting a decent correction in equity markets.Though im not sure when it will happen and how it will happen, but something big is on its way. I think its time to books some of profits and sit on cash for sometime.

Thursday, June 2, 2011

Gold Rally


With problems in Euorpe refusing to subside and dollar continuing to weaken, Gold rally doeasnt look ending anytime soon. technically its following a trend line and has nor closed below that trend line in last 3 months. ideally it should test the highs 1580 and then decide the big move on either side.A close below the trnd line might ensue a sell off but 1470 and 1450 levels would be crucial.

Monday, May 30, 2011

Corrections and Correlations


Commitement of Traders fortelling a deep correction around october. it think the smart money knows that there is something coming up in the next quarter which might upset this bull rally setting the markets into deep correction. but things look positive by the end of the year.

Sunday, May 29, 2011

Double Dip , Another recession ?


Morgan Stanley's Cyclical index predicts another downturn is on the cards. the intensity of downturn may be difficult to fathom, but the indicator has been prophetic in suggesting business cycles. As the indicator (The blue line oscillator) already pointing southward, Not so encouraging news from europe and japan, emerging markets fighting the inflation monster, the next couple of months will be crucial to define the long term story.

Sunday, May 15, 2011

US Dollar - Will the trend sustain

Dollar bounced back from its low and was trading around its 50 DMA. A close above 50 DMA will be a very bullish setup for US dollar. With QE 2 in its last leg and no QE 3 in offing, US dollar might bounce back harder then expected souring the commodity rally. All commodities are below their 50 dma which is quiet bearish for commoditites

Thursday, April 28, 2011

Oil and Economy - Different scenarios

Standard Charted provides a matrix which envisages effect of oil on economy and different assets in all the scenarios possible


Source Standard Charrted, pragcap.com

Thursday, April 14, 2011

Crude Oil Speculation

The non commercials net positions have crossed pre crisis levels. This might suggest that the speculation in the markets have reached a record high and even the slightest of bad news can bring the market sharply

Monday, April 11, 2011

Gold : Cause and Effects

this gold rally has left many perplexed. i believe gold is one of the most difficult products to trade as there are far too many variables that effect the gold markets. USFUNDS have come up with an interesting interactive chart which lists out few variables

Thursday, April 7, 2011

ECB Rate Decision

The Last time ECB increased the rate in 2008, the world got into a catastrophic Depression. Lets hope this its not the same this time around.

But few things are still similar to the last time, like Equity markets near thier top and most importantly, Crude Oil making new heights.

Deja Vu ?


Wednesday, April 6, 2011

Surge in Commodity Prices : BoJ Review

BoJ reviews the current surge in commodity prices and the usual suspects are the global central banks, the financialization of commodity markets and supply/demand mechanics.

"The entry of new financial investors has paved the way for the “financialization of commodities”. Consequently, global commodity markets have become more sensitive to portfolio rebalancing by financial investors, which has made commodity markets more correlated with other asset markets, including major equity markets. Furthermore, globally accommodative monetary conditions have played an important role in the surge in commodity prices, both by stimulating physical demand for commodities and driving more investment flows into financialized commodity markets.”"


Read the complete report


rev11e02 -

Tuesday, April 5, 2011

Euro Zone Credit Ratings

When all was looking well , the Euro Zone credit rating has returned to haunt. Political crisis in Portugal is far from over and Greece is not doing enough

to reduce its debt

Monday, March 28, 2011

The New Tech Bubble


Is it the tech Bubble 2.0 or the numbers makes sense this time ? Interesting read from NY times

http://www.nytimes.com/2011/03/28/technology/28bubble.html