Wednesday, October 26, 2011
Brent WTI Spreads
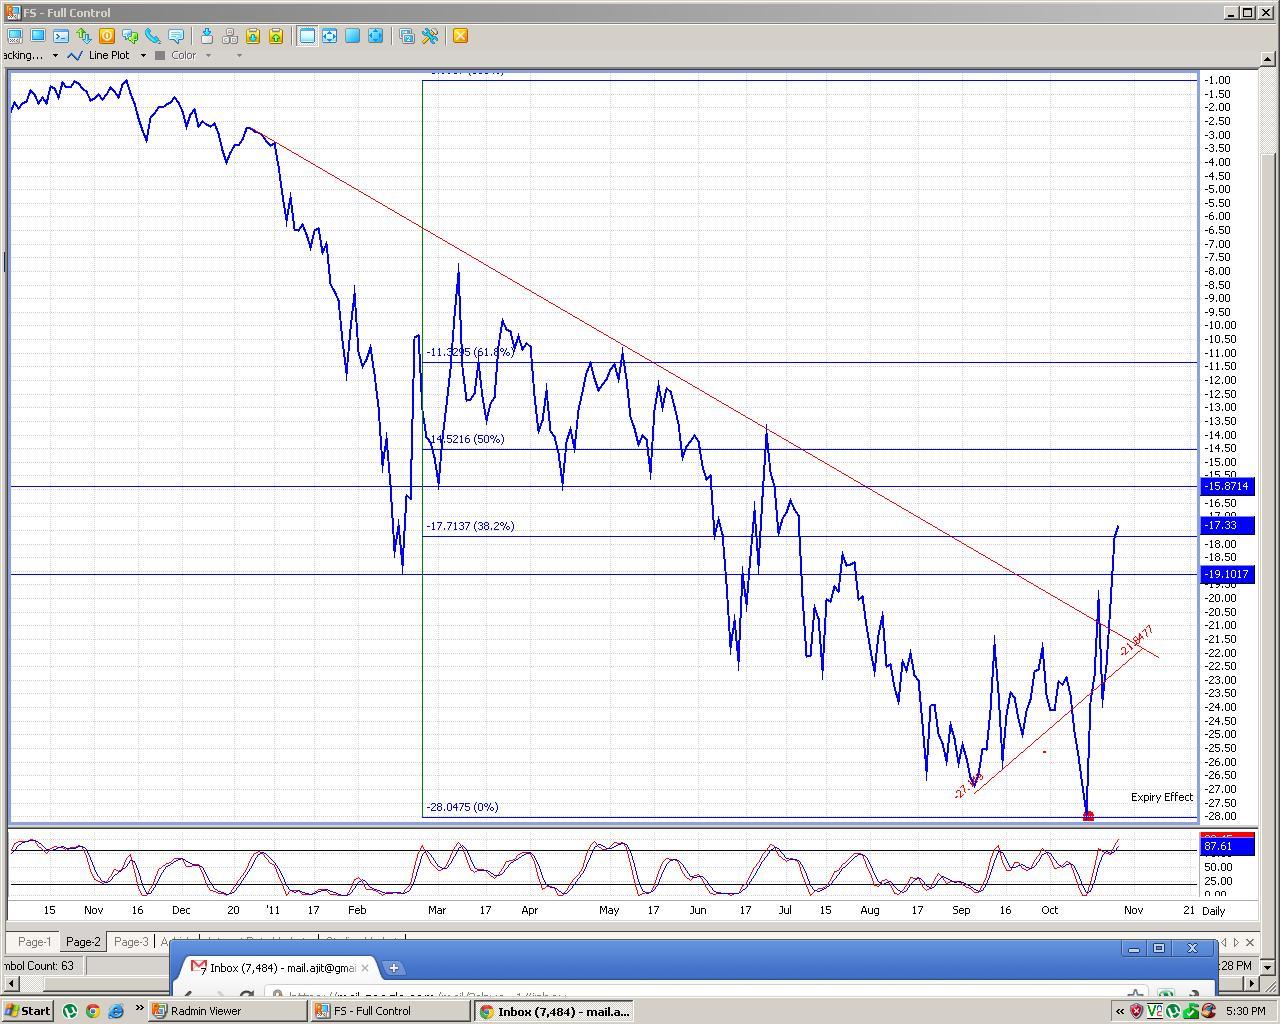
in my earlir post i spoke about that triangle pattern being formed and my hunch for spreads moving upwards.
As one can see that BW has finally broken the trend and its poised upward. Though it fell before rising upwards but it was only due to the expiring Brent that month
Monday, October 10, 2011
Brent WTI spreads
The Brent WTI spreads which widened to the historic highs of $ 26 per barrel seems to making way back. For past one month its making a higher low pattern which suggests that the short term bottom has been made and its on its recovery path. the triangle pattern which is being formed can lead to a break out on one side, the probability is more on the higher side for this spread.so in next few months we can see considerable upside in this spread
Sunday, September 25, 2011
Correction in Gold
Finally gold showed some sign of correction to its long rally.On charts it has made short term high for sure. the double top formation has actually been formed and the actual price target on the lower side could be around 1500. but i believe it will take a some time to reach those levels and there is short term bounce back that might happen. gold has reached to its Fib levels, that is 61.8 % correction levels of its last move.Moreover 100 dma at 1630 levels would also provide considerable support.
if that breaches the next support would be 1575 and then 1500.
Friday, September 16, 2011
Philly Fed and Recession
Whenever philly fed index has breached into negative territory, it is followed by a recession. Last philly fed data is indicating another recession around the corner
Friday, September 9, 2011
Dollar Breakout
DOllar has moved passed its resistant and broken out of it range. there are a previous breakout also last time in july but it tuned out ot be a fake one and market went back into its previous range. Dollar hold key to most of the markets right now. Since most of the markets are clueless and stuck in a range, a break out in dollar would be important for the direction of the market
Tuesday, September 6, 2011
Volatility and Vix
The vix looks like that it is in range. The market is entierly news driven with bouts of bad news increasing the volatility and thn positive news pacifies the market. this shows the overall trend of all the markets which i believe, will be in range for next couple of months.
World GDP and Trade
World trade is shrinking and it has been an indicator of growth of world GDP. the amount of cargo passing through the Suez Canal in Egypt. Approximately 8% of the world's international trade is estimated to flow through the canal, so it acts as a good early indicator of the prevailing economic conditions.
Subscribe to:
Posts (Atom)

